What will you learn?
The video below, delivers the main points of this blog post on Stochastic Gradient Descent (SGD): (GitHub code available in here)
In our previous 2 posts about gradient, in both post number 1 and post number 2, we did cover gradient descent in all its glory. We even went through a very detailed numerical example just to make sure we are totally convinced by the whole thing!
By the end of this post, you will learn how Stochastic Gradient Descent (SGD) works. You will visualize loss surfaces, hypothesis spaces, and you will also generate this cool animation of SGD travelling on the loss surface 😉
Today we will learn about the drawbacks of gradient descent, of which we have 2, and we will see how we can overcome these problems by not following gradient descent exactly, but by following a stochastic approximation of it, also known as , the Stochastic Gradient Descent (SGD) algorithm. We will travel with SGD in the hypothesis space of model parameters and see how SGD finds the optimal values for the learnable parameters which would correspond to the global minimum value of loss. I am ready when you are 😉
What is wrong with gradient descent?
So, we have learned that gradient descent is nothing but a search algorithm:
- Search where? The hypothesis space of all possible values for our learnable parameters.
- Search what? The optimal values for the learnable parameters of our model, which would minimize the loss.
However, we cannot use gradient descent to search any arbitrary hypothesis space! In fact some properties have to be in place before we could use this amazing search algorithm:
- The hypothesis space must contain continuously parametrized hypotheses. So, an example of such a hypothesis space, is the space of all possible weight values in a neural network. These weights are the parameters of your neural network—hence the word “parametrized”—and these weights can take continuous positive or negative values—hence the word “continuous”.
- We need to be able to differentiate our loss function with respect to the parameters of this space. As we saw in our earlier posts on gradient descent, we need this differentiability if we would want to use gradient descent and search a gigantic hypothesis space in a smarter and more guided way! This differentiation tells us:
how much we should increase or decrease a given weight parameter in our neural network, so our loss would decrease the fastest!
Of course this seems great as we are not totally blind, groping in an infinitely large space for the right weights for our neural networks (i.e., blind stupid training 😉 ). However, you need to know that gradient descent has some major issues! Let’s study them a little more closely:
- As you remember from our previous posts, in the traditional gradient descent, we would go over the entire dataset, and accumulate the entire gradients with respect to each learnable parameter (e.g., the weights in our neural network), and only after we have finished a complete sweep through the dataset, would we update these parameters. With traditional gradient descent, in order to find the global minimum in our loss, we might need to require many thousands of such gradient steps (i.e., going through the entire dataset many thousands of times).
- If there are many multiple local minima in the loss surface, then there is no guarantee that traditional gradient descent will be able to find the global minimum.
These problems are due to the fact that the traditional gradient descent can easily get trapped in any local minimum since it searches for the direction of the steepest descent on the loss surface as it finds the true gradient by going through the entire dataset, before updating the values of the parameters.
However, we need to be able to literally kick it out of those local minima, so it could explore more and not get trapped, so that maybe it could find the global minimum. In other words, we do not want the true absolute gradient vector, but a noisy estimation of it. That little imperfection actually plays in our favor and can help us NOT get trapped in a local minimum!
Stochastic Gradient Descent
Here is what we do in Stochastic Gradient Descent (SGD): For every single input data, the model computes the output. In the next step, the gradient of the error is computed with respect to each and every one of the learnable parameters in the model and according to an update rule, their values are immediately updated. It is only then that the next input data in permitted into the model. This will continue until the whole dataset is explored and fed to the model. In short, below we can see the algorithm for stochastic gradient descent:
Initialize each learnable parameter
to a small random value
Until the termination condition is met, do
For each pair of training example (
,
), do:
Feed
into the model and generate the output
Update each learnable parameter
:
In the above algorithm, , represents a given input data—It can have a certain dimensionality,
. And
represents the ground truth for the given input data. This is what the model strives to learn to predict! Here is something that might not strike you at first glance:
For every single input data,
, there is one separate loss surface!
What?! Hell yeah! I am going to show you how this happens.
Some Mathematical Pre-Requisites
In this section, I would like to define a model, that takes 1 scalar input, , and has 1 trainable parameter,
. By linearly combining them, the model produces the output
. Finally, I will define a loss function that takes the output of the model and computes the loss. For simplicity, this particular loss function does not need the ground-truth,
. This can happen in an unsupervised learning scenario!
I am sick of seeing that bloody bowl-shaped loss surface in every single machine learning book and blog (including my own blog)! Even though it is legit, I want to define a highly convex loss surface with loads of local minima and maxima. I want you to see how SGD will walk out of all of these traps and finds the global minimum!
So, let’s define our model’s output as a function of the input and the trainable weight parameter:
and our loss is computed as follows:
I know, it is a funny looking loss! I will show you how it looks like in the hypothesis space of possible values for our parameter . Of course, we will need to take the derivative of this loss with respect to our trainable parameter,
, so that SGD could actually update
, while minimizing the loss as fast as possible. So, this is the only mathematically heavy part of this post (I promise!):
From the Chain-Rule we know that:
And also, remember the multiplication rule for computing derivatives:
So, let’s first compute :
Using the multiplication rule, we have:
And we know that . I will leave the rest of the algebraic hassle to you (I believe in you ;-)), however, your final answer should be this:
Enough with the math! Let’s dive into some cool visualizations and some nice Python code.
Visualizing the Loss Surfaces
Let’s use Python to produce these cool visualizations. First, let’s import some packages:
# We will need numpy for some array functionalities
from numpy import exp
import numpy as np
# matplotlib is used for visualizations
import matplotlib.pyplot as plt
# the Axes3D package allows us to add 3-dimensional visualizations
from mpl_toolkits.mplot3d import Axes3D
Let’s now code the 2 most important functions. First one computes the loss for a given model output, . The second one, computes the derivative of the loss w.r.t the parameter
, given an input data,
:
def Loss(y):
    # Computes the loss for a given output of the model, y
    return (-y**2 + y**3)*exp(-(y**2))

def dLossdW(x,y):
    # Computes the gradient of the loss w.r.t the parameter w (Using the chain Rule)
    # First the derivative of the loss w.r.t y
    dlossdy = ((-2*y + 3*(y**2))*exp(-(y**2))) + ((-y**2 + y**3)*(-2*y*exp(-(y**2))))
    # Then the derivative of y w.r.t w
    dydw = x
    # Finally we return the multiplication of the these two, that is the gradient
    # of the loss w.r.t w
    dlossdw = dlossdy*dydw
    return dlossdw
We know that our loss function is a function of the input data, , and the learnable parameter,
. Given an input data, we can actually plot this surface! What is the name of this surface? It is actually the hypothesis space and the corresponding loss value for every value of the parameter
, in that space:
The hypothesis space, is the space of all possible values for our learnable parameters. In our case, this is a space of scalar values for our one and only learnable parameter,
! We would like to search in this space, and find a value for
, such that it minimizes our defined loss function. Stochastic Gradient Descent (SGD) is an optimization algorithm that searches the hypothesis space, by continuously updating the value of the parameters, in such a way that with every update, we would have the fastest descent in the current value of the loss.
Let’s take a look at some of the loss surfaces, given a few of the training data. For each training example, we will go over a grid of possible values of , and compute the loss for each value of
, given the fixed value of the input data.
If we have
input data, we will have
loss surfaces. It is like every data point, gives us a different perspective, a different way of looking, a different angle to see the loss surface corresponding to the hypothesis space, that is the possible values for the learnable parameters!
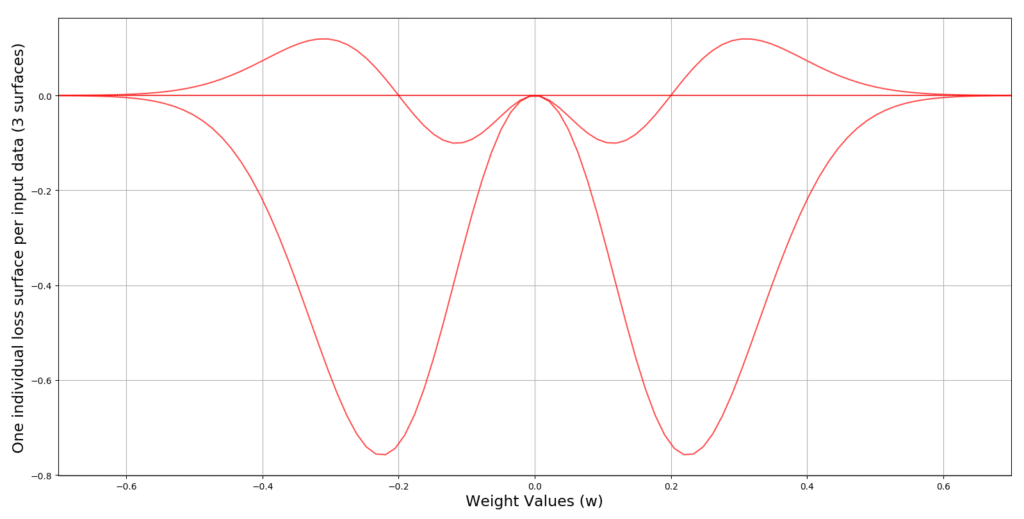
The following code produces 3 input data, and plots 3 loss surfaces for us, across the hypothesis space of .
# 3 data points between -5 and 5 are selected
X = np.linspace(-5, 5, 3)
# A range of possible values for parameter w is selected
W = np.linspace(-0.7, 0.7, 100)
# Create a figure
plt.figure()
# iterate through the entire dataset and for each value of x repeat the following
for x in X:
    # compute the output of the model
    y = W*x
    # Plot the current loss surface for x, across the the entire range of values
    # For the parameter w
    plt.plot(W, Loss(y), c='r', alpha=0.7)

# define the limits for horizontal axis (the weight axis)
plt.xlim(min(W), max(W))
# put the labels for weight and loss axes
plt.xlabel('Weight Values (w)', size=17)
plt.ylabel('One individual loss surface per input data (%d surfaces)' % len(X), size=17)
# Put grids on the plot for better visualization
plt.grid()
# Show the plot
plt.show()
The output of this code produces the following 3 loss surfaces:
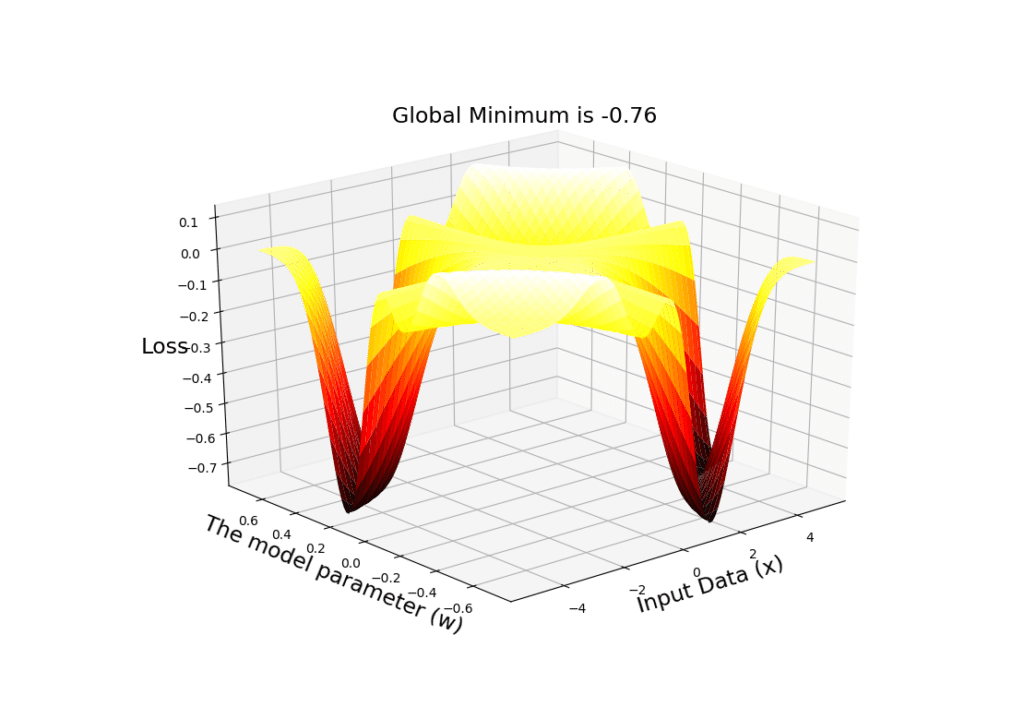
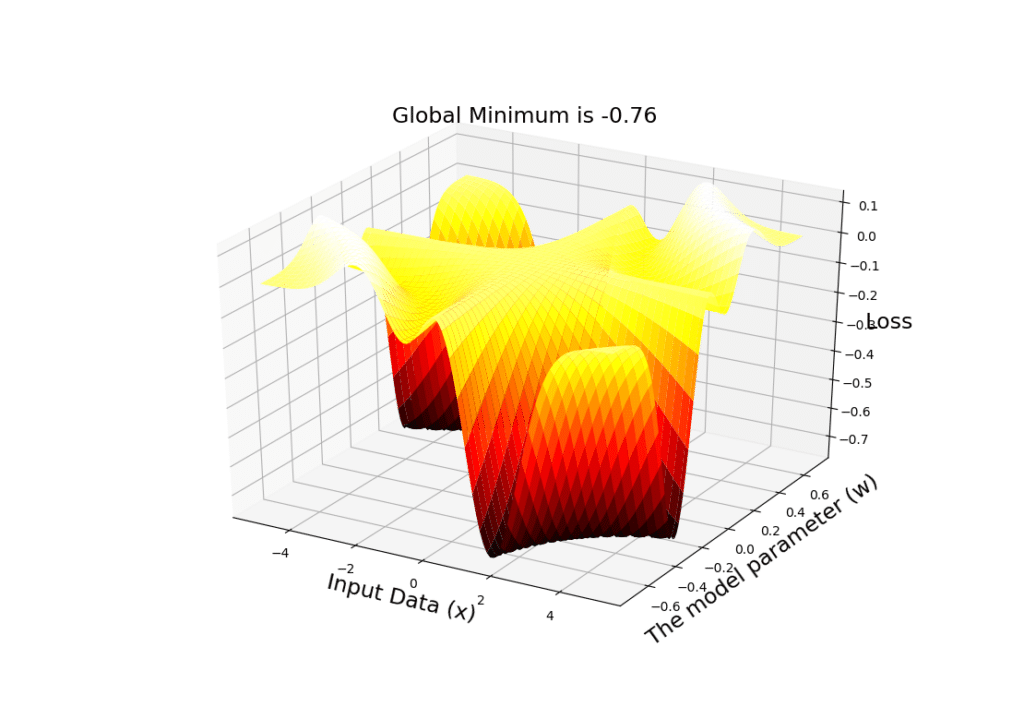
I would like to show you, a 3-dimensional view of many of such surfaces! In other words, a visualization across a range of values for the input data , and the learnable parameter,
and the computed loss value corresponding to each pair of (
,
)! This shows you how much indeed, can the loss surface change, with even a small change in the value of
! The code below, creates a grid of values for
and
, computes the loss for each pair of (
,
) and visualizes a 3-dimensional plot:
# Define a range of values for input data
X = np.linspace(-5, 5, 100)
# Define a range of values for the parameter w
W = np.linspace(-0.7, 0.7, 100)
# Create a mesh grid of these to vectors
x, w = np.meshgrid(X, W)
# Compute the output of the model for each pair of values in the mesh
y = w*x
# Create a figure
fig = plt.figure()
# Tell matplotlib that this is going to be a 3-dimensional plot
ax = plt.axes(projection='3d')
# use the plot_surface function and a nice cmap to plot the loss surface w.r.t all pairs of (x,w) in the mesh
ax.plot_surface(x, w, Loss(y), rstride=2, cstride=2,
                cmap='hot', edgecolor='none')
# Set labels for the axes
ax.set_xlabel('Input Data (x)', size=17)
ax.set_ylabel('The model parameter (w)', size=17)
ax.set_zlabel('Loss', size=17)
# Compute the value of the global minimum
plt.title('Global Minimum is %.2f' % np.min(Loss(y)), size=17)
# Show the 3-dimensional surface
plt.show()
We can see the output of the code below, from 2 different perspectives. Note that the global minimum is -0.76:
A very important point:
SGD will NOT take place on this 3D surface! Note that this is NOT our hypothesis space! For a given input data
, we will have a 2D plot (that we have shown in the previous plot)! That is on those individual surfaces (that show the loss value in our hypothesis space for the given constant input data
) that SGD will travel and search for the optimal value of
that can minimize the loss!
Perfect! Now we are going to do something really cool! We will define a dataset of scalar values, and feed each one into our model, produce the model output, and compute the loss. Then compute the gradient at a particular weight value and compute the new value for
, and call it
. By computing the corresponding loss value for
and
, we basically have the coordinates of the start and the end of the update vector for our parameter,
.
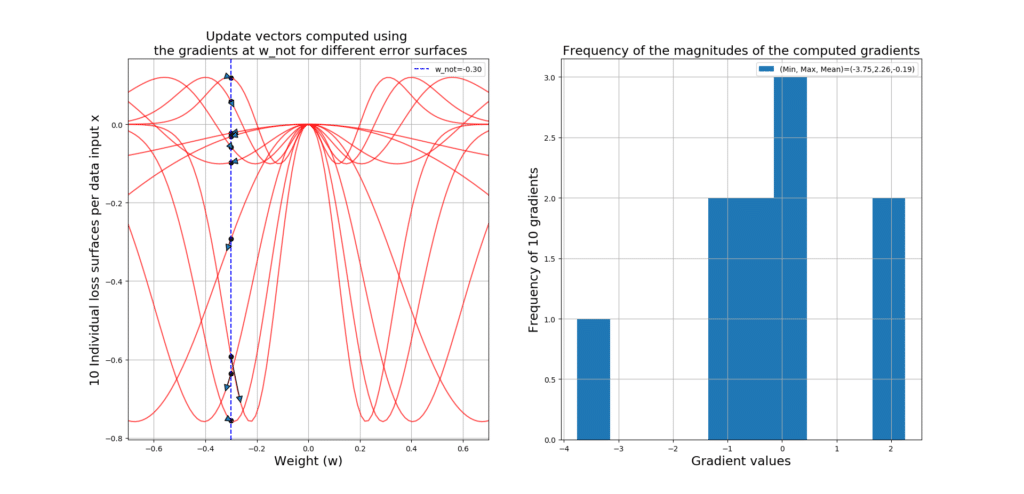
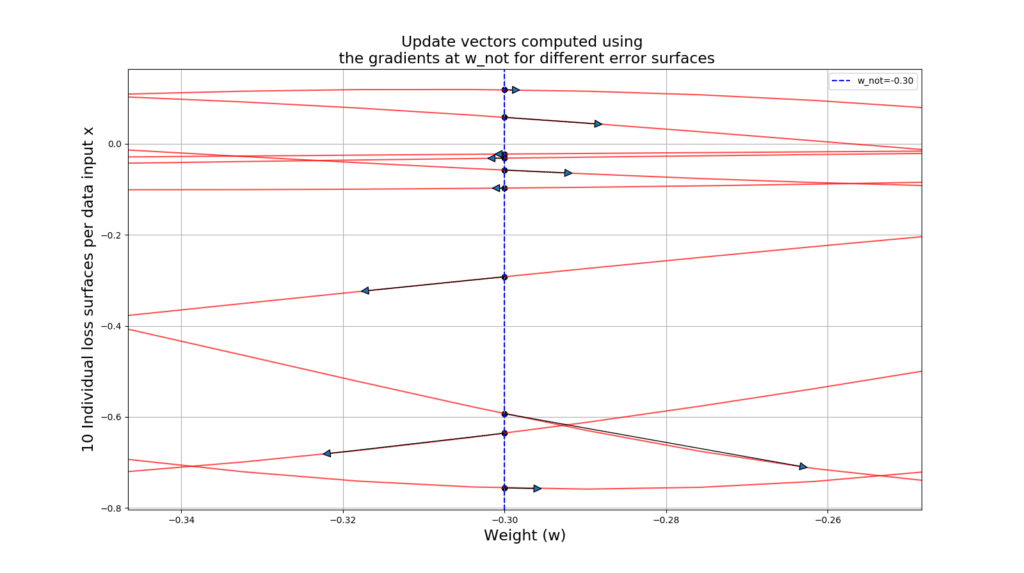
Given each data point, at point , we will compute a different gradient value, since the loss surface changes for every input example! So, if we have 100 input data, then we will have 100 loss surfaces, and 100 gradient values at
across all 100 loss surfaces. Using a histogram, we can gain some insight into the magnitudes of these gradients regarding their distribution, and some statistics like the minimum, maximum and average of them.
So when you hear people saying SGD is really noisy, it is because of the fact that, for every input data, you will have a different error surface and gradient, which you will use to update your parameters! However, this noise can be really helpful, to help you JUMP OUT of the local minima! In other words, it will literally KICK you OUT of the local minima with the hope that you could find the global minimum (i.e., -0.76 in our example).
Let’s take a look at the code that will generate 10 loss surfaces, plots the update vector starting at and ending in
:
# Define a range of values for input data x
X = np.linspace(-5, 5, 10)
# Define a grid of values for the parameter w
W = np.linspace(-0.7, 0.7, 100)
# Define an initial value of w_not (where we start learning from)
w_not = -0.3
# Define the learning rate
eta = 0.01

# Create a figure in which we will put 2 subplots
fig = plt.figure(figsize=(16,9))
# Create the first subplot
plt.subplot(1, 2, 1)
# Give a title for the subplot
plt.title('Update vectors computed using \n '
          'the gradients at w_not for different error surfaces')
# This variable is giong to be used for plotting the update vectors! This
# Makes the vectors look nice and symmetrical
prop = dict(arrowstyle="-|>,head_width=0.4,head_length=0.8",shrinkA=0, shrinkB=0)

# This will hold the computed gradients at w_not, across all loss surfaces given each individual data x
gradients = []
# Go through the entire dataset X, and for each data point x do the following
for x in X:
    # Compute model output
    y = w_not*x
    # Compute the gradient of the error w.r.t the parameter w, given current value of the input data
    dedw = dLossdW(x,y)
    # Add the gradient to the list for future visualizations
    gradients.append(dedw)
    # Compute the new value of the parameter w NOTE: We are not yet updating w_not!
    w_new = w_not - eta*dedw
    # Plot the loss surface for the current input data x, across possible values of the parameter w
    plt.plot(W,Loss(W*x), c='r', alpha=0.7)
    # Plot the initial w_not and its corresponding loss value Loss(y) given x, so we know where on
    # The loss surface we reside
    plt.scatter(w_not, Loss(y), c='k')
    # Using the (w_not,Loss(y)) and the new value of the weight that results in the point (w_new, Loss(w_new*x))
    # Plot the update vector between w_not and w_new
    plt.annotate("", xy=(w_new, Loss(w_new*x)), xytext=(w_not, Loss(y)), arrowprops=prop)
    # Put a limit on the weight axis using the minimum and maximum values we have considered for w
    plt.xlim(min(W), max(W))

# Put labels per axis
plt.xlabel('Weight (w)',size=17)
plt.ylabel('%d Individual loss surfaces per data input x' % len(X), size=17)
# Plot a nice vertical blue line at w_not so we know where we stand INITIALLY across ALL loss surfaces
plt.axvline(w_not, ls='--', c='b',label='w_not=%.2f' % w_not)
# Show the legends
plt.legend()
# Put a nice grid
plt.grid()

# Prepare the second subplot
plt.subplot(1,2,2)
# Put a nice title for the histogram
plt.title('Frequency of the magnitudes of the computed gradients')
# Plot the histogram of gradients, along some nice statistics of these gradients
plt.hist(gradients, label='(Min, Max, Mean)=(%.2f,%.2f,%.2f)' % (np.min(gradients), np.max(gradients),np.mean(gradients)))
# Make the legends visible
plt.legend()
# Put some nice axis labels
plt.xlabel('Gradient values', size=17)
plt.ylabel('Frequency of %d gradients' % len(X), size=17)
# Put a nice grid
plt.grid()
# Show the whole plot with both subplots
plt.show()
The output gives you the gradient vectors over 10 different loss surfaces, along side a histogram giving you some insight into these gradients! See how noisy SGD can get!!!
Below you can see a zoomed-in version so you can see the actual update vectors:
Travelling with SGD
Here is the reward for all of you who have survived this far! Let’s apply the SGD algorithm, and search the hypothesis space for the best value for our learnable parameter , so that hopefully we could find the global minimum 0.76. The main part to focus on in the code below is that:
For every input data, after computing the gradient at current
, we will UPDATE
, as this is how SGD works! This way we will use the noise, imposed on the loss surface by every input example
.
Let’s travel with SGD on many loss surfaces and see how we will occasionally get trapped at some local minima but SGD, due to its stochasticity (where for EVERY data point we have a different loss surface), kicks us out of those minima! See how this will help us find the global minimum! The code below, initiates SGD and the travel in the hypothesis space:
# The description of these lines is same as before
X = np.linspace(-5, 5, 100)
W = np.linspace(-0.7, 0.7, 100)
w_not = -0.3
eta = 0.01
# We keep the initial value of w_not in a variable, because we WILL update w_not using SGD this time!
origin = w_not

plt.figure(figsize=(16,9))
prop = dict(arrowstyle="-|>,head_width=0.4,head_length=0.8",
                shrinkA=0, shrinkB=0)

for i, x in enumerate(X):

    # This is there to clear the previous plot in the animation, so the next one can be plotted over
    plt.clf()
    y = w_not * x
    dedw = dLossdW(x, y)
    # Remember, we just want to compute w_new first so we can plot the update vector
    # Between w_not and w_new, BEFORE we actually update w_not!
    w_new = w_not - eta * dedw

    # Compute the loss at both w_not and the newly computed w_new. These will help with plotting the update vectors
    y_w_not = Loss(w_not * x)
    y_w_new = Loss(w_new * x)

    # Let's keep the initial value of w_not (that we have saved in origin) and plot a vertical line on it
    # So we will always clearly see where SGD started its magic from!
    plt.axvline(origin, ls='--', c='b',label='origin =%.2f' % origin)

    # Plot the loss surface for the given data point x
    plt.plot(W, Loss(W * x), c='r', alpha=0.7, label = 'current loss =%.2f' % y_w_new)
    plt.legend()
    # Plot the current w_not and the corresponding loss value (i.e., y_w_not) BEFORE updating w_not
    plt.scatter(w_not, y_w_not, c='k')
    # Plot the update vector between w_not and w_new for the current loss surface, given the current input data x
    plt.annotate("", xy=(w_new, y_w_new), xytext=(w_not, y_w_not), arrowprops=prop)
    plt.grid()
    plt.xlabel('Weights (w)', size=17)
    plt.ylabel('Individual loss surface for a given input data (x)', size=17)
    plt.title('Changes in loss surface given the %d th input data' % (i + 1), size=17)
    # Put limits for a better animation
    plt.xlim(min(W), max(W))
    plt.ylim(-1.0, 0.5)
    # This controls the speed of the animation in terms of milli-seconds
    plt.pause(0.1)
    # Fanally: Before inputting the next input value into the model, we UPDATE w_not!!! This is where SGD
    # changes the current value of the learned parameter w, so that it could find the global minimum that is -0.76
    # In our example
    w_not = w_new
See the beautiful generated animation below. Notice how we get stuck in local minima and even in a fully flat surface where gradient is 0, but the change in the loss surface kicks us of out of them.
Note that the current loss becomes 0.76 in the end, which is the same as our global minimum!
Conclusion
SGD iterates through the entire training set, for each input data, it updates the learnable parameters of the model according to the gradient with respect to those parameters. This iteration and sequential updates over all the training examples, provides a reasonable approximation to descending in the direction of the True Gradient which is computed and used in the traditional Gradient Descent algorithm. SGD provides an approximation of the true gradient vector, and its noisy by nature! We have seen how this noise can help us avoid getting trapped into the local minima, which is really important when the loss surface has many such local minima!
